The Pencil Code
a high-order finite-difference code for compressible MHD

Highlight:
Coronal heating problem
The corona of the Sun was observed to be very hot, which is since then rather unexplained. Large-scale 3D-MHD models can nowadays test whole scenarios for coronal heating theories in computational models. With the Pencil Code, one such numerical experiment was performed on several German-national and European-international super computers (like Curie in France and JuRoPA in Germany). This model run consumed in total about 20 million CPU-core hours on Intel Nehalem processors and ran typically on 1024 cores simultaneously. To enable this research, efficient massive-parallel communication and file-input/output was implemented in the Pencil Code in the recent years.
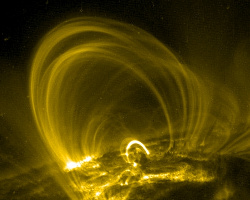
To model the coronal heating properly, it is important to include also the energy sinks, e.g. by radiative losses or heat conduction that usually transports energy back to the lower atmosphere. From the self-consistently computed plasma density and temperature we synthesize data with an atomic database (CHIANTI) that we directly compare to real extreme-UV observations of the corona (upper right: TRACE/NASA).

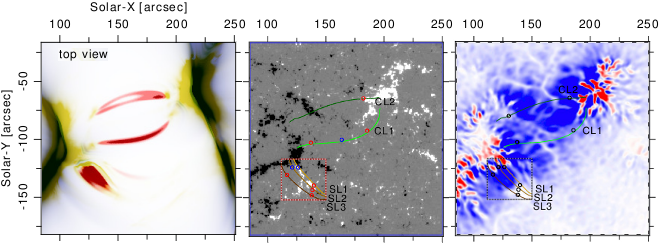
We show here a view from top onto the coronal model that features several hot loops with extreme-UV emission in the spectral lines of, e.g., Fe XV (red, left panel), which is generated by million Kelvin hot plasma. This emission clearly follows, as expected, the magnetic field (lines, middle panel), because the heat conduction is very efficient parallel to the magnetic field lines. As responsible for the coronal energy input, we could identify the vertical Poynting flux into the corona (blue/red = positive/negative, right panel), that is caused by horizontal shuffling motions from photospheric granulation. These motions avect the footpoints of magnetic field lines in the photosphere, where the plasma beta is large and hence the so-called field-line braiding mechanism injects magnetic energy from below. While these magnetic disturbances travel into the corona they may induce electric currents, which eventually heat the plasma by Ohmic dissipation.
The model is driven by an active region magnetogram observed in the photosphere (black/gray/white, middle panel) and reproduces well observations of the corona. This explains the magnetic energy input and yields to realistic coronal heating in the active region core.
References:- Tschernitz & Bourdin (2025), ApJL 979/2, L39 (ADS, DOI: 10.3847/2041-8213/adac4f)
- Pandey & Bourdin (2025), A&A 693, A89 (ADS, DOI: 10.1051/0004-6361/202450170)
- Bourdin (2020), GAFD 114, 235 (ADS, DOI: 10.1080/03091929.2019.1643849)
- Bourdin et al. (2018), ApJ 869, 2 (ADS, DOI: 10.3847/1538-4357/aae97a)
- Bourdin (2017), ApJL 850, L29 (ADS, DOI: 10.3847/2041-8213/aa9988)
- Bourdin et al. (2016), A&A 589, A86 (ADS, DOI: 10.1051/0004-6361/201525840)
- Bourdin et al. (2015), A&A 580, A72 (ADS, DOI: 10.1051/0004-6361/201525839)
- Bourdin et al. (2014), PASJ 66, S7 (ADS, DOI: 10.1093/pasj/psu123)
- Bourdin et al. (2013), A&A 555, A123 (ADS, DOI: 10.1051/0004-6361/201321185)